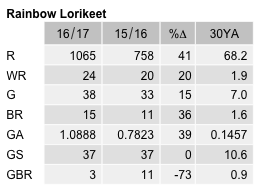
Rainbow Lorikeet
Trichoglossus moluccanus
ABR description
The following is extracted from the Annual Bird Report for the twelve months to June 2017.
Common, breeding resident
A resident population in Belconnen region gradually spreading south.
General: 1077 records from 41 grids (758 records from 33 last year). As in previous years many records from Belconnen suburbs, however, there are now records throughout Canberra. Reporting rate 7.6%, 17% higher than last year and three times the 30YA. Since 2006-2007, the reporting rate has risen steadily from 0.7% to the current value, a significant increase over the 10-year period. Records from all months, winter 32% and summer 20%. Mean 3.3, median 2 with max 30/24 Feb Aranda (BuM1). 16 breeding records from 6 grid cells (11 last year from 1 grid cell): earliest dy/6 Aug Fadden Hills Pond (CaR3), latest br/21 Jan Narrabundah Hill (CaJ4).
GBS: Abundance was 39% higher than last year and about 7.5 times the 30YA. 783 records from 37 sites (63%), including many on the south side. Max 32/1wk Dec Waramanga (LaD3) with average 3.6, median 2. Observed in 52 weeks with more sightings in autumn (29%). 3 breeding records from 1 site in Page: dy/2wk Feb, 4wk Mar, 1wk Apr Page (AlB1).
Abundance
Abundance is the average number of birds of that species per survey. Where the species was observed (presence recorded) but the number of birds seen was not recorded, this is treated as a count of zero.
Abundance by year
This chart shows the abundance of Rainbow Lorikeet between 1982 and 2017. 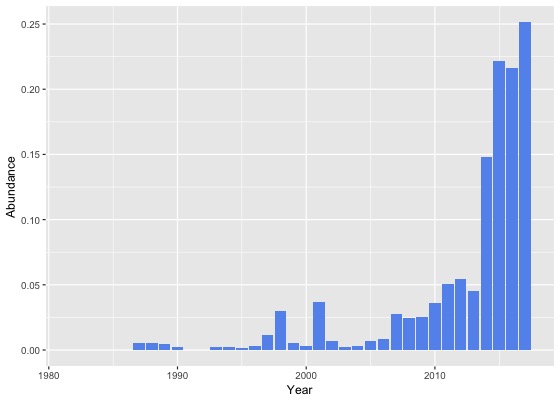
Abundance by month
This chart shows the monthly abundance of Rainbow Lorikeet. The blue lines show the abundance for the twelve months to June 2017 and the bars show the average abundance for the period 1982 to 2017. 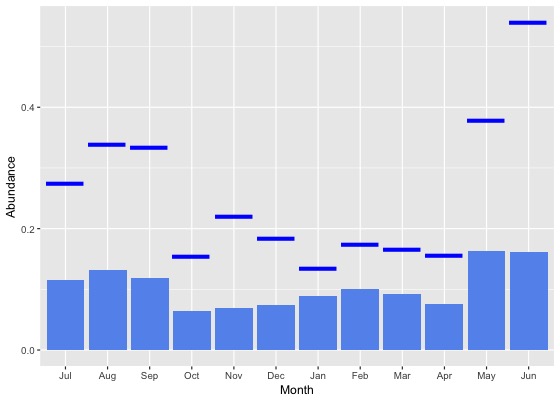
Abundance by season
This chart shows the seasonal abundance of Rainbow Lorikeet. The blue lines show the seasonal abundance for the twelve months to June 2017 and the bars show the average seasonal abundance for the period 1982 to 2017. 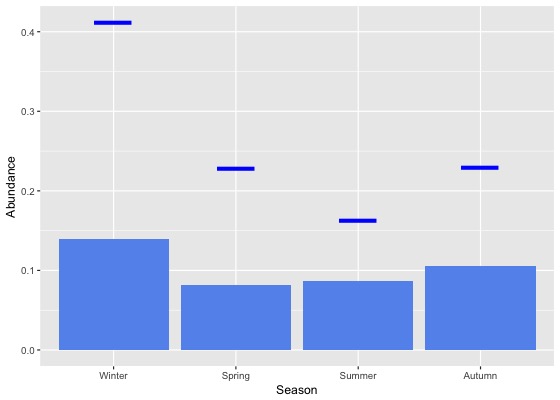
Abundance data
| Month | Season | ||||||||||||||||||
|---|---|---|---|---|---|---|---|---|---|---|---|---|---|---|---|---|---|---|---|
| Period | Jul | Aug | Sep | Oct | Nov | Dec | Jan | Feb | Mar | Apr | May | Jun | Winter | Spring | Summer | Autumn | All | ||
| All years | |||||||||||||||||||
| All | 0.1 | 0.1 | 0.1 | 0.1 | 0.1 | 0.1 | 0.1 | 0.1 | 0.1 | 0.1 | 0.2 | 0.2 | 0.1 | 0.1 | 0.1 | 0.1 | 0.1 | ||
| Previous years | |||||||||||||||||||
| All previous years | 0.1 | 0.1 | 0.1 | 0.1 | 0.0 | 0.1 | 0.1 | 0.1 | 0.1 | 0.1 | 0.1 | 0.1 | 0.1 | 0.1 | 0.1 | 0.1 | 0.1 | ||
| Previous 30 years | 0.1 | 0.1 | 0.1 | 0.1 | 0.0 | 0.1 | 0.1 | 0.1 | 0.1 | 0.1 | 0.1 | 0.1 | 0.1 | 0.1 | 0.1 | 0.1 | 0.1 | ||
| Previous 20 years | 0.1 | 0.1 | 0.1 | 0.1 | 0.1 | 0.1 | 0.1 | 0.1 | 0.1 | 0.1 | 0.1 | 0.1 | 0.1 | 0.1 | 0.1 | 0.1 | 0.1 | ||
| 10 year groups | |||||||||||||||||||
| [2007,2017) | 0.2 | 0.2 | 0.2 | 0.1 | 0.1 | 0.1 | 0.1 | 0.1 | 0.1 | 0.1 | 0.2 | 0.2 | 0.2 | 0.1 | 0.1 | 0.1 | 0.1 | ||
| [1997,2007) | 0.0 | 0.0 | 0.0 | 0.0 | 0.0 | 0.0 | 0.0 | 0.0 | 0.0 | 0.0 | 0.0 | 0.0 | 0.0 | 0.0 | 0.0 | 0.0 | 0.0 | ||
| [1987,1997) | 0.0 | 0.0 | 0.0 | 0.0 | 0.0 | 0.0 | 0.0 | 0.0 | 0.0 | 0.0 | 0.0 | 0.0 | 0.0 | 0.0 | 0.0 | 0.0 | 0.0 | ||
| 5 year groups | |||||||||||||||||||
| [2012,2017) | 0.2 | 0.2 | 0.2 | 0.1 | 0.1 | 0.1 | 0.1 | 0.2 | 0.2 | 0.1 | 0.3 | 0.2 | 0.2 | 0.1 | 0.1 | 0.2 | 0.2 | ||
| [2007,2012) | 0.0 | 0.1 | 0.0 | 0.0 | 0.0 | 0.0 | 0.0 | 0.0 | 0.0 | 0.0 | 0.0 | 0.0 | 0.0 | 0.0 | 0.0 | 0.0 | 0.0 | ||
| [2002,2007) | 0.0 | 0.0 | 0.0 | 0.0 | 0.0 | 0.0 | 0.0 | 0.0 | 0.0 | 0.0 | 0.0 | 0.0 | 0.0 | 0.0 | 0.0 | 0.0 | 0.0 | ||
| [1997,2002) | 0.0 | 0.0 | 0.0 | 0.0 | 0.0 | 0.0 | 0.0 | 0.0 | 0.0 | 0.0 | 0.0 | 0.0 | 0.0 | 0.0 | 0.0 | 0.0 | 0.0 | ||
| [1992,1997) | 0.0 | 0.0 | 0.0 | 0.0 | 0.0 | 0.0 | 0.0 | 0.0 | 0.0 | 0.0 | 0.0 | 0.0 | 0.0 | 0.0 | 0.0 | 0.0 | 0.0 | ||
| [1987,1992) | 0.0 | 0.0 | 0.0 | 0.0 | 0.0 | 0.0 | 0.0 | 0.0 | 0.0 | 0.0 | 0.0 | 0.0 | 0.0 | 0.0 | 0.0 | 0.0 | 0.0 | ||
| Year | |||||||||||||||||||
| 2017 | 0.3 | 0.3 | 0.3 | 0.2 | 0.2 | 0.2 | 0.1 | 0.2 | 0.2 | 0.2 | 0.4 | 0.5 | 0.4 | 0.2 | 0.2 | 0.2 | 0.3 | ||
| 2016 | 0.2 | 0.2 | 0.3 | 0.2 | 0.2 | 0.1 | 0.2 | 0.2 | 0.2 | 0.2 | 0.3 | 0.2 | 0.2 | 0.2 | 0.2 | 0.2 | 0.2 | ||
| 2015 | 0.3 | 0.3 | 0.3 | 0.1 | 0.1 | 0.1 | 0.2 | 0.2 | 0.3 | 0.2 | 0.4 | 0.3 | 0.3 | 0.2 | 0.2 | 0.3 | 0.2 | ||
| 2014 | 0.6 | 0.1 | 0.1 | 0.1 | 0.0 | 0.2 | 0.1 | 0.3 | 0.1 | 0.1 | 0.1 | 0.4 | 0.3 | 0.1 | 0.2 | 0.1 | 0.1 | ||
| 2013 | 0.0 | 0.0 | 0.0 | 0.1 | 0.0 | 0.0 | 0.0 | 0.1 | 0.0 | 0.1 | 0.1 | 0.0 | 0.0 | 0.0 | 0.0 | 0.1 | 0.0 | ||
| 2012 | 0.0 | 0.1 | 0.0 | 0.0 | 0.0 | 0.2 | 0.0 | 0.0 | 0.1 | 0.0 | 0.1 | 0.0 | 0.1 | 0.0 | 0.1 | 0.1 | 0.1 | ||
| 2011 | 0.1 | 0.1 | 0.0 | 0.1 | 0.0 | 0.1 | 0.1 | 0.1 | 0.0 | 0.0 | 0.0 | 0.0 | 0.1 | 0.1 | 0.1 | 0.0 | 0.1 | ||
| 2010 | 0.0 | 0.0 | 0.0 | 0.0 | 0.1 | 0.0 | 0.0 | 0.0 | 0.0 | 0.0 | 0.0 | 0.1 | 0.0 | 0.0 | 0.0 | 0.0 | 0.0 | ||
| 2009 | 0.0 | 0.0 | 0.0 | 0.0 | 0.0 | 0.1 | 0.1 | 0.0 | 0.0 | 0.0 | 0.0 | 0.0 | 0.0 | 0.0 | 0.1 | 0.0 | 0.0 | ||
| 2008 | 0.0 | 0.1 | 0.0 | 0.0 | 0.0 | 0.1 | 0.0 | 0.0 | 0.0 | 0.0 | 0.0 | 0.0 | 0.0 | 0.0 | 0.1 | 0.0 | 0.0 | ||
| 2007 | 0.1 | 0.1 | 0.0 | 0.0 | 0.0 | 0.0 | 0.0 | 0.1 | 0.1 | 0.0 | 0.1 | 0.0 | 0.0 | 0.0 | 0.0 | 0.0 | 0.0 | ||
| 2006 | 0.0 | 0.0 | 0.0 | 0.0 | 0.0 | 0.0 | 0.0 | 0.0 | 0.0 | 0.0 | 0.0 | 0.0 | 0.0 | 0.0 | 0.0 | 0.0 | 0.0 | ||
| 2005 | 0.0 | 0.0 | 0.0 | 0.0 | 0.0 | 0.0 | 0.0 | 0.0 | 0.0 | 0.0 | 0.0 | 0.0 | 0.0 | 0.0 | 0.0 | 0.0 | 0.0 | ||
| 2004 | 0.0 | 0.0 | 0.0 | 0.0 | 0.0 | 0.0 | 0.0 | 0.0 | 0.0 | 0.0 | 0.0 | 0.0 | 0.0 | 0.0 | 0.0 | 0.0 | 0.0 | ||
| 2003 | 0.0 | 0.0 | 0.0 | 0.0 | 0.0 | 0.0 | 0.0 | 0.0 | 0.0 | 0.0 | 0.0 | 0.0 | 0.0 | 0.0 | 0.0 | 0.0 | 0.0 | ||
| 2002 | 0.0 | 0.0 | 0.0 | 0.0 | 0.0 | 0.0 | 0.0 | 0.0 | 0.0 | 0.0 | 0.0 | 0.0 | 0.0 | 0.0 | 0.0 | 0.0 | 0.0 | ||
| 2001 | 0.0 | 0.0 | 0.0 | 0.0 | 0.0 | 0.0 | 0.0 | 0.0 | 0.0 | 0.1 | 0.0 | 0.0 | 0.0 | 0.0 | 0.0 | 0.1 | 0.0 | ||
| 2000 | 0.0 | 0.0 | 0.0 | 0.0 | 0.0 | 0.0 | 0.0 | 0.0 | 0.0 | 0.0 | 0.0 | 0.0 | 0.0 | 0.0 | 0.0 | 0.0 | 0.0 | ||
| 1999 | 0.1 | 0.0 | 0.0 | 0.0 | 0.0 | 0.0 | 0.0 | 0.0 | 0.0 | 0.0 | 0.0 | 0.0 | 0.0 | 0.0 | 0.0 | 0.0 | 0.0 | ||
| 1998 | 0.0 | 0.1 | 0.0 | 0.0 | 0.0 | 0.0 | 0.0 | 0.1 | 0.0 | 0.1 | 0.5 | 0.0 | 0.0 | 0.0 | 0.0 | 0.1 | 0.0 | ||
| 1997 | 0.0 | 0.0 | 0.0 | 0.0 | 0.0 | 0.0 | 0.0 | 0.0 | 0.0 | 0.0 | 0.1 | 0.0 | 0.0 | 0.0 | 0.0 | 0.0 | 0.0 | ||
| 1996 | 0.0 | 0.0 | 0.0 | 0.0 | 0.0 | 0.0 | 0.0 | 0.0 | 0.0 | 0.0 | 0.0 | 0.0 | 0.0 | 0.0 | 0.0 | 0.0 | 0.0 | ||
| 1995 | 0.0 | 0.0 | 0.0 | 0.0 | 0.0 | 0.0 | 0.0 | 0.0 | 0.0 | 0.0 | 0.0 | 0.0 | 0.0 | 0.0 | 0.0 | 0.0 | 0.0 | ||
| 1994 | 0.0 | 0.0 | 0.0 | 0.0 | 0.0 | 0.0 | 0.0 | 0.0 | 0.0 | 0.0 | 0.0 | 0.0 | 0.0 | 0.0 | 0.0 | 0.0 | 0.0 | ||
| 1993 | 0.0 | 0.0 | 0.0 | 0.0 | 0.0 | 0.0 | 0.0 | 0.0 | 0.0 | 0.0 | 0.0 | 0.0 | 0.0 | 0.0 | 0.0 | 0.0 | 0.0 | ||
| 1992 | 0.0 | 0.0 | 0.0 | 0.0 | 0.0 | 0.0 | 0.0 | 0.0 | 0.0 | 0.0 | 0.0 | 0.0 | 0.0 | 0.0 | 0.0 | 0.0 | 0.0 | ||
| 1991 | 0.0 | 0.0 | 0.0 | 0.0 | 0.0 | 0.0 | 0.0 | 0.0 | 0.0 | 0.0 | 0.0 | 0.0 | 0.0 | 0.0 | 0.0 | 0.0 | 0.0 | ||
| 1990 | 0.0 | 0.0 | 0.0 | 0.0 | 0.0 | 0.0 | 0.0 | 0.0 | 0.0 | 0.0 | 0.0 | 0.0 | 0.0 | 0.0 | 0.0 | 0.0 | 0.0 | ||
| 1989 | 0.0 | 0.0 | 0.0 | 0.0 | 0.0 | 0.0 | 0.0 | 0.0 | 0.0 | 0.0 | 0.0 | 0.0 | 0.0 | 0.0 | 0.0 | 0.0 | 0.0 | ||
| 1988 | 0.0 | 0.0 | 0.0 | 0.0 | 0.0 | 0.0 | 0.0 | 0.0 | 0.0 | 0.0 | 0.0 | 0.0 | 0.0 | 0.0 | 0.0 | 0.0 | 0.0 | ||
| 1987 | 0.0 | 0.0 | 0.0 | 0.0 | 0.0 | 0.0 | 0.0 | 0.0 | 0.0 | 0.0 | 0.0 | 0.0 | 0.0 | 0.0 | 0.0 | 0.0 | 0.0 | ||
| 1986 | 0.0 | 0.0 | 0.0 | 0.0 | 0.0 | 0.0 | 0.0 | 0.0 | 0.0 | 0.0 | 0.0 | 0.0 | 0.0 | 0.0 | 0.0 | 0.0 | 0.0 | ||
| 1985 | 0.0 | 0.0 | 0.0 | 0.0 | 0.0 | 0.0 | 0.0 | 0.0 | 0.0 | 0.0 | 0.0 | 0.0 | 0.0 | 0.0 | 0.0 | 0.0 | 0.0 | ||
| 1984 | 0.0 | 0.0 | 0.0 | 0.0 | 0.0 | 0.0 | 0.0 | 0.0 | 0.0 | 0.0 | 0.0 | 0.0 | 0.0 | 0.0 | 0.0 | 0.0 | 0.0 | ||
| 1983 | 0.0 | 0.0 | 0.0 | 0.0 | 0.0 | 0.0 | 0.0 | 0.0 | 0.0 | - | 0.0 | 0.0 | 0.0 | 0.0 | 0.0 | 0.0 | 0.0 | ||
| 1982 | - | 0.0 | - | 0.0 | 0.0 | 0.0 | - | 0.0 | - | 0.0 | - | 0.0 | 0.0 | 0.0 | 0.0 | 0.0 | 0.0 | ||
Reporting rates
Reporting rate is the proportion of all surveys in which the species was present.
Reporting rate by year
This chart shows the reporting rate of Rainbow Lorikeet each year between 1982 and 2017. 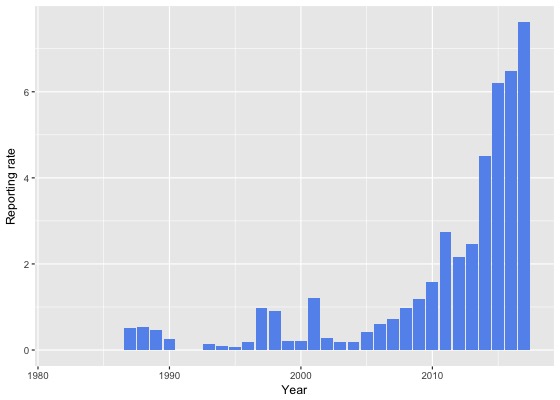
Reporting rate by month
This chart shows the reporting rate by month of Rainbow Lorikeet. The blue lines show the reporting rate for the twelve months to June 2017 and the bars show the average reporting rate for the period 1982 to 2017. 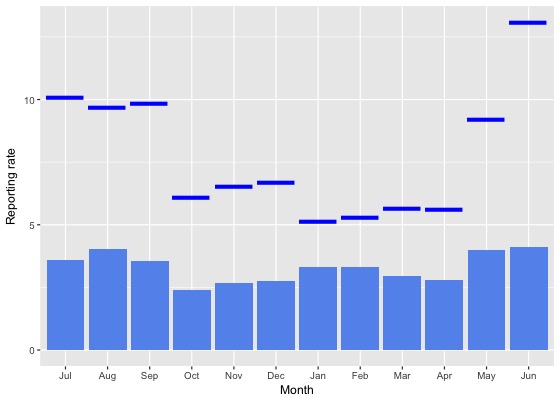
Reporting rate by season
This chart shows the seasonal reporting rate of Rainbow Lorikeet. The blue lines show the seasonal reporting rate for the twelve months to June 2017 and the bars show the average seasonal reporting rate for the period 1982 to 2017. 
Reporting rate data
| Month | Season | ||||||||||||||||||
|---|---|---|---|---|---|---|---|---|---|---|---|---|---|---|---|---|---|---|---|
| Period | Jul | Aug | Sep | Oct | Nov | Dec | Jan | Feb | Mar | Apr | May | Jun | Winter | Spring | Summer | Autumn | All | ||
| All years | |||||||||||||||||||
| All | 3.6 | 4.0 | 3.5 | 2.4 | 2.7 | 2.8 | 3.3 | 3.3 | 3.0 | 2.8 | 4.0 | 4.1 | 3.9 | 2.8 | 3.1 | 3.2 | 3.2 | ||
| Previous years | |||||||||||||||||||
| All previous years | 2.6 | 2.9 | 2.7 | 1.9 | 2.0 | 2.2 | 3.0 | 2.9 | 2.5 | 2.3 | 2.8 | 2.4 | 2.6 | 2.2 | 2.7 | 2.5 | 2.5 | ||
| Previous 30 years | 2.6 | 3.0 | 2.7 | 1.9 | 2.1 | 2.2 | 3.0 | 2.9 | 2.5 | 2.4 | 2.8 | 2.4 | 2.7 | 2.2 | 2.7 | 2.5 | 2.5 | ||
| Previous 20 years | 3.3 | 3.9 | 3.1 | 2.2 | 2.6 | 2.6 | 3.5 | 3.5 | 2.9 | 2.8 | 3.5 | 2.8 | 3.3 | 2.6 | 3.1 | 3.0 | 3.0 | ||
| 10 year groups | |||||||||||||||||||
| [2007,2017) | 5.0 | 5.4 | 4.4 | 2.8 | 3.8 | 3.6 | 4.4 | 4.6 | 4.0 | 3.6 | 4.7 | 4.0 | 4.7 | 3.5 | 4.2 | 4.0 | 4.0 | ||
| [1997,2007) | 0.4 | 0.8 | 0.3 | 0.4 | 0.2 | 0.6 | 0.5 | 0.6 | 0.5 | 0.6 | 0.7 | 0.3 | 0.5 | 0.3 | 0.6 | 0.6 | 0.5 | ||
| [1987,1997) | 0.2 | 0.2 | 0.7 | 0.2 | 0.3 | 0.2 | 0.2 | 0.5 | 0.3 | 0.3 | 0.3 | 0.4 | 0.2 | 0.4 | 0.3 | 0.3 | 0.3 | ||
| 5 year groups | |||||||||||||||||||
| [2012,2017) | 6.2 | 6.2 | 6.0 | 3.6 | 4.4 | 4.4 | 4.9 | 5.0 | 5.0 | 4.9 | 6.1 | 5.2 | 5.8 | 4.5 | 4.8 | 5.2 | 5.0 | ||
| [2007,2012) | 1.7 | 2.5 | 1.0 | 1.3 | 2.0 | 2.0 | 2.4 | 2.5 | 1.2 | 0.5 | 0.8 | 1.6 | 1.8 | 1.4 | 2.2 | 0.8 | 1.5 | ||
| [2002,2007) | 0.6 | 1.0 | 0.2 | 0.3 | 0.3 | 0.2 | 0.4 | 0.3 | 0.2 | 0.1 | 0.3 | 0.4 | 0.6 | 0.3 | 0.3 | 0.2 | 0.3 | ||
| [1997,2002) | 0.2 | 0.6 | 0.5 | 0.4 | 0.1 | 1.1 | 0.6 | 0.9 | 0.9 | 1.3 | 1.1 | 0.3 | 0.3 | 0.4 | 0.9 | 1.1 | 0.7 | ||
| [1992,1997) | 0.0 | 0.0 | 0.0 | 0.2 | 0.4 | 0.0 | 0.0 | 0.0 | 0.0 | 0.0 | 0.5 | 0.0 | 0.0 | 0.2 | 0.0 | 0.2 | 0.1 | ||
| [1987,1992) | 0.3 | 0.3 | 1.1 | 0.2 | 0.3 | 0.3 | 0.3 | 0.7 | 0.5 | 0.5 | 0.1 | 0.6 | 0.4 | 0.5 | 0.4 | 0.4 | 0.4 | ||
| Year | |||||||||||||||||||
| 2017 | 10.1 | 9.7 | 9.9 | 6.1 | 6.5 | 6.7 | 5.1 | 5.3 | 5.7 | 5.6 | 9.2 | 13.1 | 11.3 | 7.4 | 5.7 | 6.8 | 7.6 | ||
| 2016 | 7.2 | 7.0 | 9.1 | 5.1 | 8.5 | 5.8 | 6.3 | 4.9 | 6.5 | 5.5 | 7.7 | 6.0 | 6.7 | 7.2 | 5.6 | 6.4 | 6.5 | ||
| 2015 | 8.2 | 10.1 | 8.1 | 4.1 | 3.2 | 4.1 | 6.4 | 6.4 | 5.5 | 6.6 | 7.3 | 7.4 | 8.3 | 5.1 | 5.7 | 6.4 | 6.2 | ||
| 2014 | 9.7 | 5.0 | 3.6 | 3.8 | 4.1 | 4.6 | 4.0 | 5.6 | 4.2 | 3.6 | 3.3 | 6.3 | 6.6 | 3.8 | 4.6 | 3.8 | 4.5 | ||
| 2013 | 1.4 | 0.9 | 1.0 | 1.9 | 1.8 | 2.6 | 2.7 | 4.4 | 2.8 | 4.9 | 3.8 | 0.7 | 1.0 | 1.6 | 3.0 | 3.7 | 2.5 | ||
| 2012 | 2.4 | 2.4 | 2.0 | 1.7 | 1.1 | 4.6 | 2.7 | 1.5 | 3.3 | 1.1 | 2.1 | 1.2 | 1.9 | 1.6 | 3.1 | 2.1 | 2.2 | ||
| 2011 | 5.7 | 5.6 | 1.6 | 3.8 | 1.2 | 3.9 | 4.4 | 3.7 | 1.6 | 0.6 | 0.4 | 2.3 | 3.7 | 2.7 | 4.0 | 0.9 | 2.7 | ||
| 2010 | 1.0 | 0.9 | 1.5 | 1.1 | 3.3 | 0.7 | 2.4 | 2.4 | 1.2 | 0.4 | 1.0 | 3.4 | 2.3 | 1.7 | 1.6 | 0.8 | 1.6 | ||
| 2009 | 0.7 | 2.1 | 1.5 | 1.1 | 2.2 | 1.6 | 1.3 | 0.8 | 1.4 | 0.4 | 0.8 | 0.5 | 0.9 | 1.5 | 1.3 | 0.8 | 1.2 | ||
| 2008 | 0.0 | 1.7 | 0.4 | 0.2 | 2.0 | 2.7 | 1.6 | 1.9 | 1.1 | 0.9 | 0.9 | 0.9 | 0.8 | 0.5 | 2.2 | 1.0 | 1.0 | ||
| 2007 | 1.1 | 1.9 | 0.0 | 0.5 | 0.7 | 0.7 | 0.8 | 2.6 | 0.9 | 0.0 | 1.6 | 0.7 | 1.0 | 0.4 | 1.0 | 0.7 | 0.7 | ||
| 2006 | 0.0 | 3.9 | 0.0 | 0.8 | 0.6 | 0.0 | 1.1 | 0.7 | 0.6 | 0.0 | 0.0 | 0.8 | 1.2 | 0.5 | 0.6 | 0.3 | 0.6 | ||
| 2005 | 2.2 | 0.9 | 0.7 | 0.6 | 0.7 | 0.0 | 0.0 | 1.1 | 0.0 | 0.0 | 0.0 | 0.0 | 0.8 | 0.7 | 0.2 | 0.0 | 0.4 | ||
| 2004 | 0.0 | 0.0 | 0.0 | 0.0 | 0.6 | 0.5 | 0.0 | 0.0 | 0.5 | 0.5 | 0.0 | 0.0 | 0.0 | 0.2 | 0.2 | 0.4 | 0.2 | ||
| 2003 | 0.0 | 0.0 | 0.0 | 0.0 | 0.0 | 0.0 | 0.7 | 0.0 | 0.0 | 0.0 | 0.8 | 1.2 | 0.5 | 0.0 | 0.2 | 0.2 | 0.2 | ||
| 2002 | 1.1 | 0.8 | 0.0 | 0.0 | 0.0 | 0.6 | 0.0 | 0.0 | 0.0 | 0.0 | 1.2 | 0.0 | 0.6 | 0.0 | 0.3 | 0.2 | 0.3 | ||
| 2001 | 0.0 | 0.6 | 1.2 | 0.8 | 0.6 | 1.8 | 1.0 | 1.5 | 0.9 | 3.4 | 1.7 | 1.0 | 0.5 | 0.9 | 1.5 | 1.8 | 1.2 | ||
| 2000 | 0.0 | 0.7 | 0.0 | 0.0 | 0.0 | 0.0 | 0.4 | 0.0 | 1.2 | 0.0 | 0.0 | 0.0 | 0.2 | 0.0 | 0.1 | 0.5 | 0.2 | ||
| 1999 | 2.9 | 0.0 | 0.0 | 0.6 | 0.0 | 0.6 | 0.0 | 0.0 | 0.5 | 0.0 | 0.0 | 0.0 | 0.3 | 0.2 | 0.2 | 0.2 | 0.2 | ||
| 1998 | 0.0 | 1.9 | 0.8 | 0.0 | 0.0 | 0.0 | 1.5 | 3.8 | 0.0 | 2.6 | 7.4 | 0.0 | 0.6 | 0.3 | 1.3 | 1.9 | 0.9 | ||
| 1997 | 0.0 | 0.0 | 0.0 | 0.0 | 0.0 | 3.8 | 0.0 | 1.8 | 2.5 | 1.8 | 2.2 | 0.0 | 0.0 | 0.0 | 2.4 | 2.1 | 1.0 | ||
| 1996 | 0.0 | 0.0 | 0.0 | 0.0 | 1.9 | 0.0 | 0.0 | 0.0 | 0.0 | 0.0 | 0.0 | 0.0 | 0.0 | 0.7 | 0.0 | 0.0 | 0.2 | ||
| 1995 | 0.0 | 0.0 | 0.0 | 0.6 | 0.0 | 0.0 | 0.0 | 0.0 | 0.0 | 0.0 | 0.0 | 0.0 | 0.0 | 0.3 | 0.0 | 0.0 | 0.1 | ||
| 1994 | 0.0 | 0.0 | 0.0 | 0.0 | 0.0 | 0.0 | 0.0 | 0.0 | 0.0 | 0.0 | 1.2 | 0.0 | 0.0 | 0.0 | 0.0 | 0.3 | 0.1 | ||
| 1993 | 0.0 | 0.0 | 0.0 | 0.0 | 0.0 | 0.0 | 0.0 | 0.0 | 0.0 | 0.0 | 1.3 | 0.0 | 0.0 | 0.0 | 0.0 | 0.5 | 0.1 | ||
| 1992 | 0.0 | 0.0 | 0.0 | 0.0 | 0.0 | 0.0 | 0.0 | 0.0 | 0.0 | 0.0 | 0.0 | 0.0 | 0.0 | 0.0 | 0.0 | 0.0 | 0.0 | ||
| 1991 | 0.0 | 0.0 | 0.0 | 0.0 | 0.0 | 0.0 | 0.0 | 0.0 | 0.0 | 0.0 | 0.0 | 0.0 | 0.0 | 0.0 | 0.0 | 0.0 | 0.0 | ||
| 1990 | 0.6 | 0.0 | 2.2 | 0.0 | 0.0 | 0.0 | 0.0 | 0.0 | 0.0 | 0.0 | 0.0 | 0.0 | 0.2 | 0.7 | 0.0 | 0.0 | 0.3 | ||
| 1989 | 0.5 | 0.4 | 1.3 | 0.0 | 0.5 | 0.4 | 0.5 | 0.0 | 0.6 | 0.0 | 0.0 | 1.2 | 0.7 | 0.6 | 0.3 | 0.2 | 0.5 | ||
| 1988 | 0.0 | 0.4 | 1.7 | 0.4 | 0.3 | 0.0 | 0.0 | 0.6 | 1.5 | 1.1 | 0.0 | 1.0 | 0.4 | 0.7 | 0.2 | 0.9 | 0.5 | ||
| 1987 | 0.0 | 0.0 | 0.4 | 0.4 | 0.3 | 0.5 | 0.5 | 1.7 | 0.0 | 0.8 | 0.4 | 0.0 | 0.0 | 0.4 | 0.9 | 0.4 | 0.5 | ||
| 1986 | 0.0 | 0.0 | 0.0 | 0.0 | 0.0 | 0.0 | 0.0 | 0.0 | 0.0 | 0.0 | 0.0 | 0.0 | 0.0 | 0.0 | 0.0 | 0.0 | 0.0 | ||
| 1985 | 0.0 | 0.0 | 0.0 | 0.0 | 0.0 | 0.0 | 0.0 | 0.0 | 0.0 | 0.0 | 0.0 | 0.0 | 0.0 | 0.0 | 0.0 | 0.0 | 0.0 | ||
| 1984 | 0.0 | 0.0 | 0.0 | 0.0 | 0.0 | 0.0 | 0.0 | 0.0 | 0.0 | 0.0 | 0.0 | 0.0 | 0.0 | 0.0 | 0.0 | 0.0 | 0.0 | ||
| 1983 | 0.0 | 0.0 | 0.0 | 0.0 | 0.0 | 0.0 | 0.0 | 0.0 | 0.0 | - | 0.0 | 0.0 | 0.0 | 0.0 | 0.0 | 0.0 | 0.0 | ||
| 1982 | - | 0.0 | - | 0.0 | 0.0 | 0.0 | - | 0.0 | - | 0.0 | - | 0.0 | 0.0 | 0.0 | 0.0 | 0.0 | 0.0 | ||
Breeding data
Breeding records by month
Number of breeding records by breeding code and month, 2017 and all years| Breeding code | Jul | Aug | Sep | Oct | Nov | Dec | Jan | Feb | Mar | Apr | May | Jun |
|---|---|---|---|---|---|---|---|---|---|---|---|---|
| 2017 | ||||||||||||
| Breeding (BLA code) | 0 | 1 | 0 | 0 | 0 | 0 | 1 | 0 | 0 | 0 | 0 | 0 |
| Carrying Food | 0 | 0 | 0 | 0 | 0 | 0 | 0 | 0 | 0 | 0 | 0 | 0 |
| Copulating | 0 | 0 | 0 | 0 | 0 | 0 | 0 | 0 | 0 | 0 | 0 | 0 |
| Display | 0 | 0 | 0 | 0 | 0 | 0 | 0 | 0 | 0 | 0 | 0 | 0 |
| Dependent young | 0 | 2 | 0 | 0 | 1 | 0 | 0 | 0 | 0 | 0 | 0 | 0 |
| Faecal sac | 0 | 0 | 0 | 0 | 0 | 0 | 0 | 0 | 0 | 0 | 0 | 0 |
| Inspecting hollow | 0 | 1 | 2 | 0 | 0 | 0 | 0 | 0 | 0 | 0 | 0 | 0 |
| Nest building | 0 | 0 | 0 | 0 | 0 | 0 | 0 | 0 | 0 | 0 | 0 | 0 |
| Nest with eggs | 0 | 0 | 0 | 0 | 0 | 0 | 0 | 0 | 0 | 0 | 0 | 0 |
| Nest with young | 0 | 0 | 0 | 1 | 2 | 0 | 0 | 0 | 0 | 0 | 0 | 0 |
| On/leaving nest | 0 | 1 | 2 | 0 | 0 | 2 | 0 | 0 | 0 | 0 | 0 | 0 |
| All years | ||||||||||||
| Breeding (BLA code) | 0 | 1 | 0 | 0 | 0 | 0 | 2 | 1 | 0 | 0 | 0 | 0 |
| Carrying Food | 0 | 0 | 0 | 0 | 0 | 0 | 0 | 0 | 0 | 0 | 0 | 0 |
| Copulating | 0 | 0 | 0 | 0 | 0 | 0 | 0 | 0 | 0 | 0 | 0 | 0 |
| Display | 0 | 0 | 0 | 1 | 0 | 0 | 0 | 0 | 0 | 0 | 0 | 0 |
| Dependent young | 1 | 2 | 0 | 0 | 2 | 4 | 1 | 0 | 0 | 0 | 0 | 0 |
| Faecal sac | 0 | 0 | 0 | 0 | 0 | 0 | 0 | 0 | 0 | 0 | 0 | 0 |
| Inspecting hollow | 0 | 2 | 5 | 2 | 2 | 1 | 4 | 2 | 0 | 1 | 0 | 3 |
| Nest building | 0 | 0 | 0 | 0 | 0 | 0 | 0 | 0 | 0 | 0 | 0 | 0 |
| Nest with eggs | 0 | 0 | 0 | 0 | 0 | 0 | 0 | 0 | 0 | 0 | 0 | 0 |
| Nest with young | 0 | 0 | 0 | 1 | 3 | 0 | 0 | 2 | 2 | 1 | 0 | 0 |
| On/leaving nest | 1 | 1 | 3 | 5 | 1 | 4 | 0 | 0 | 1 | 1 | 0 | 1 |
Breeding records by year
Average number of breeding records per period by breeding code| Period | Breeding (BLA code) | Carrying Food | Copulating | Display | Dependent young | Faecal sac | Inspecting hollow | Nest building | Nest with eggs | Nest with young | On/leaving nest |
|---|---|---|---|---|---|---|---|---|---|---|---|
| All years | |||||||||||
| All | 0.1 | 0.0 | 0.0 | 0.0 | 0.3 | 0.0 | 0.6 | 0.0 | 0.0 | 0.2 | 0.5 |
| Previous years | |||||||||||
| All previous years | 0.1 | 0.0 | 0.0 | 0.0 | 0.2 | 0.0 | 0.5 | 0.0 | 0.0 | 0.2 | 0.4 |
| Previous 30 years | 0.1 | 0.0 | 0.0 | 0.0 | 0.2 | 0.0 | 0.6 | 0.0 | 0.0 | 0.2 | 0.4 |
| Previous 20 years | 0.1 | 0.0 | 0.0 | 0.0 | 0.3 | 0.0 | 0.9 | 0.0 | 0.0 | 0.3 | 0.7 |
| 10 year groups | |||||||||||
| [2007,2017) | 0.2 | 0.0 | 0.0 | 0.1 | 0.5 | 0.0 | 1.8 | 0.0 | 0.0 | 0.6 | 1.3 |
| [1997,2007) | 0.0 | 0.0 | 0.0 | 0.0 | 0.2 | 0.0 | 0.1 | 0.0 | 0.0 | 0.0 | 0.0 |
| [1987,1997) | 0.0 | 0.0 | 0.0 | 0.0 | 0.0 | 0.0 | 0.0 | 0.0 | 0.0 | 0.0 | 0.0 |
| 5 year groups | |||||||||||
| [2012,2017) | 0.2 | 0.0 | 0.0 | 0.2 | 0.6 | 0.0 | 2.6 | 0.0 | 0.0 | 1.2 | 2.0 |
| [2007,2012) | 0.2 | 0.0 | 0.0 | 0.0 | 0.4 | 0.0 | 1.0 | 0.0 | 0.0 | 0.0 | 0.6 |
| [2002,2007) | 0.0 | 0.0 | 0.0 | 0.0 | 0.0 | 0.0 | 0.0 | 0.0 | 0.0 | 0.0 | 0.0 |
| [1997,2002) | 0.0 | 0.0 | 0.0 | 0.0 | 0.4 | 0.0 | 0.2 | 0.0 | 0.0 | 0.0 | 0.0 |
| [1992,1997) | 0.0 | 0.0 | 0.0 | 0.0 | 0.0 | 0.0 | 0.0 | 0.0 | 0.0 | 0.0 | 0.0 |
| [1987,1992) | 0.0 | 0.0 | 0.0 | 0.0 | 0.0 | 0.0 | 0.0 | 0.0 | 0.0 | 0.0 | 0.0 |
| Year | |||||||||||
| 2017 | 2.0 | 0.0 | 0.0 | 0.0 | 3.0 | 0.0 | 3.0 | 0.0 | 0.0 | 3.0 | 5.0 |
| 2016 | 0.0 | 0.0 | 0.0 | 0.0 | 0.0 | 0.0 | 4.0 | 0.0 | 0.0 | 2.0 | 5.0 |
| 2015 | 0.0 | 0.0 | 0.0 | 1.0 | 2.0 | 0.0 | 6.0 | 0.0 | 0.0 | 4.0 | 1.0 |
| 2014 | 0.0 | 0.0 | 0.0 | 0.0 | 1.0 | 0.0 | 3.0 | 0.0 | 0.0 | 0.0 | 0.0 |
| 2013 | 0.0 | 0.0 | 0.0 | 0.0 | 0.0 | 0.0 | 0.0 | 0.0 | 0.0 | 0.0 | 1.0 |
| 2012 | 1.0 | 0.0 | 0.0 | 0.0 | 0.0 | 0.0 | 0.0 | 0.0 | 0.0 | 0.0 | 3.0 |
| 2011 | 0.0 | 0.0 | 0.0 | 0.0 | 0.0 | 0.0 | 0.0 | 0.0 | 0.0 | 0.0 | 1.0 |
| 2010 | 0.0 | 0.0 | 0.0 | 0.0 | 0.0 | 0.0 | 2.0 | 0.0 | 0.0 | 0.0 | 1.0 |
| 2009 | 0.0 | 0.0 | 0.0 | 0.0 | 1.0 | 0.0 | 3.0 | 0.0 | 0.0 | 0.0 | 1.0 |
| 2008 | 1.0 | 0.0 | 0.0 | 0.0 | 1.0 | 0.0 | 0.0 | 0.0 | 0.0 | 0.0 | 0.0 |
| 2007 | 0.0 | 0.0 | 0.0 | 0.0 | 0.0 | 0.0 | 0.0 | 0.0 | 0.0 | 0.0 | 0.0 |
| 2006 | 0.0 | 0.0 | 0.0 | 0.0 | 0.0 | 0.0 | 0.0 | 0.0 | 0.0 | 0.0 | 0.0 |
| 2005 | 0.0 | 0.0 | 0.0 | 0.0 | 0.0 | 0.0 | 0.0 | 0.0 | 0.0 | 0.0 | 0.0 |
| 2004 | 0.0 | 0.0 | 0.0 | 0.0 | 0.0 | 0.0 | 0.0 | 0.0 | 0.0 | 0.0 | 0.0 |
| 2003 | 0.0 | 0.0 | 0.0 | 0.0 | 0.0 | 0.0 | 0.0 | 0.0 | 0.0 | 0.0 | 0.0 |
| 2002 | 0.0 | 0.0 | 0.0 | 0.0 | 0.0 | 0.0 | 0.0 | 0.0 | 0.0 | 0.0 | 0.0 |
| 2001 | 0.0 | 0.0 | 0.0 | 0.0 | 2.0 | 0.0 | 0.0 | 0.0 | 0.0 | 0.0 | 0.0 |
| 2000 | 0.0 | 0.0 | 0.0 | 0.0 | 0.0 | 0.0 | 0.0 | 0.0 | 0.0 | 0.0 | 0.0 |
| 1999 | 0.0 | 0.0 | 0.0 | 0.0 | 0.0 | 0.0 | 0.0 | 0.0 | 0.0 | 0.0 | 0.0 |
| 1998 | 0.0 | 0.0 | 0.0 | 0.0 | 0.0 | 0.0 | 0.0 | 0.0 | 0.0 | 0.0 | 0.0 |
| 1997 | 0.0 | 0.0 | 0.0 | 0.0 | 0.0 | 0.0 | 1.0 | 0.0 | 0.0 | 0.0 | 0.0 |
| 1996 | 0.0 | 0.0 | 0.0 | 0.0 | 0.0 | 0.0 | 0.0 | 0.0 | 0.0 | 0.0 | 0.0 |
| 1995 | 0.0 | 0.0 | 0.0 | 0.0 | 0.0 | 0.0 | 0.0 | 0.0 | 0.0 | 0.0 | 0.0 |
| 1994 | 0.0 | 0.0 | 0.0 | 0.0 | 0.0 | 0.0 | 0.0 | 0.0 | 0.0 | 0.0 | 0.0 |
| 1993 | 0.0 | 0.0 | 0.0 | 0.0 | 0.0 | 0.0 | 0.0 | 0.0 | 0.0 | 0.0 | 0.0 |
| 1992 | 0.0 | 0.0 | 0.0 | 0.0 | 0.0 | 0.0 | 0.0 | 0.0 | 0.0 | 0.0 | 0.0 |
| 1991 | 0.0 | 0.0 | 0.0 | 0.0 | 0.0 | 0.0 | 0.0 | 0.0 | 0.0 | 0.0 | 0.0 |
| 1990 | 0.0 | 0.0 | 0.0 | 0.0 | 0.0 | 0.0 | 0.0 | 0.0 | 0.0 | 0.0 | 0.0 |
| 1989 | 0.0 | 0.0 | 0.0 | 0.0 | 0.0 | 0.0 | 0.0 | 0.0 | 0.0 | 0.0 | 0.0 |
| 1988 | 0.0 | 0.0 | 0.0 | 0.0 | 0.0 | 0.0 | 0.0 | 0.0 | 0.0 | 0.0 | 0.0 |
| 1987 | 0.0 | 0.0 | 0.0 | 0.0 | 0.0 | 0.0 | 0.0 | 0.0 | 0.0 | 0.0 | 0.0 |
| 1986 | 0.0 | 0.0 | 0.0 | 0.0 | 0.0 | 0.0 | 0.0 | 0.0 | 0.0 | 0.0 | 0.0 |
| 1985 | 0.0 | 0.0 | 0.0 | 0.0 | 0.0 | 0.0 | 0.0 | 0.0 | 0.0 | 0.0 | 0.0 |
| 1984 | 0.0 | 0.0 | 0.0 | 0.0 | 0.0 | 0.0 | 0.0 | 0.0 | 0.0 | 0.0 | 0.0 |
| 1983 | 0.0 | 0.0 | 0.0 | 0.0 | 0.0 | 0.0 | 0.0 | 0.0 | 0.0 | 0.0 | 0.0 |
| 1982 | 0.0 | 0.0 | 0.0 | 0.0 | 0.0 | 0.0 | 0.0 | 0.0 | 0.0 | 0.0 | 0.0 |
Distribution map
Distribution - 2017
This map shows the observed distribution of the Rainbow Lorikeet for 2017.
The red circles are the grid cells where Rainbow Lorikeet have been reported.
The transparency of the red circles indicate how many surveys sheets were submitted for that grid cell; the darker the red the more reliable the data. Of the 315 grid cells with reports, 83 had only one sheet; an example is grid number A11.
The size of the circle represents the reporting rate. The maximum reporting rate for Rainbow Lorikeet was 41.0% (eg grid number Z1) and the minimum was 0.2% (eg grid number J14). 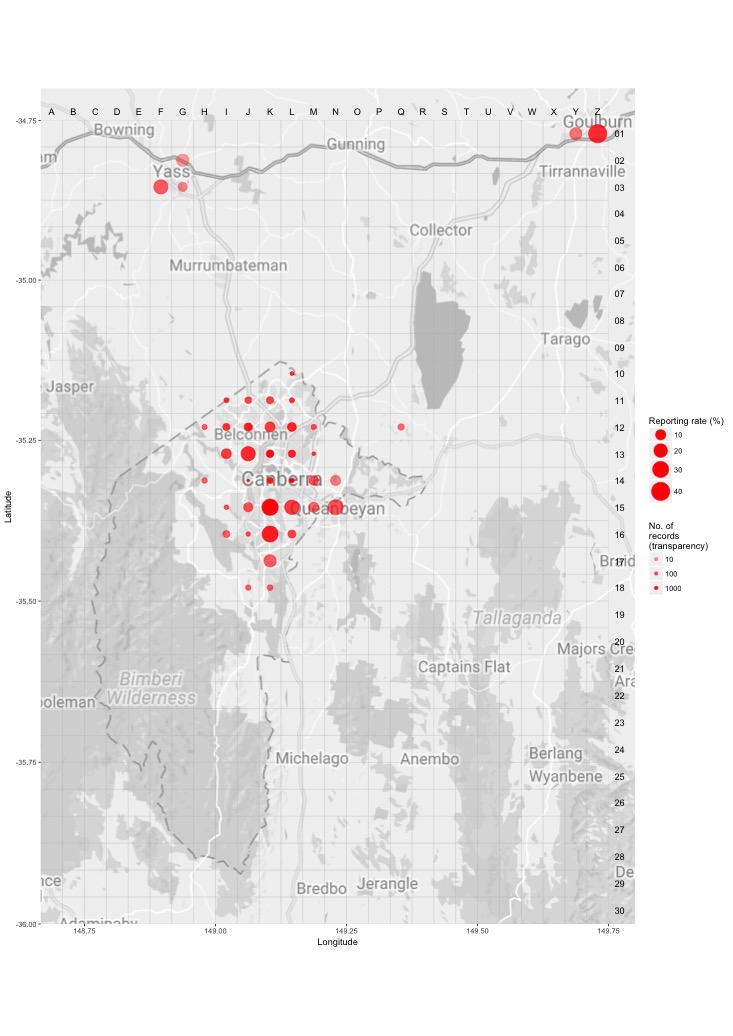
Distribution - all years
This map shows the observed distribution of the Rainbow Lorikeet for all years.
The red circles are the grid cells where Rainbow Lorikeet have been reported.
The transparency of the red circles indicate how many surveys sheets were submitted for that grid cell; the darker the red the more reliable the data. Of the 703 grid cells with reports, 55 had only one sheet; an example is grid number A12.
The size of the circle represents the reporting rate. The maximum reporting rate for Rainbow Lorikeet was 27.0% (eg grid number K15) and the minimum was 0.1% (eg grid number M11). 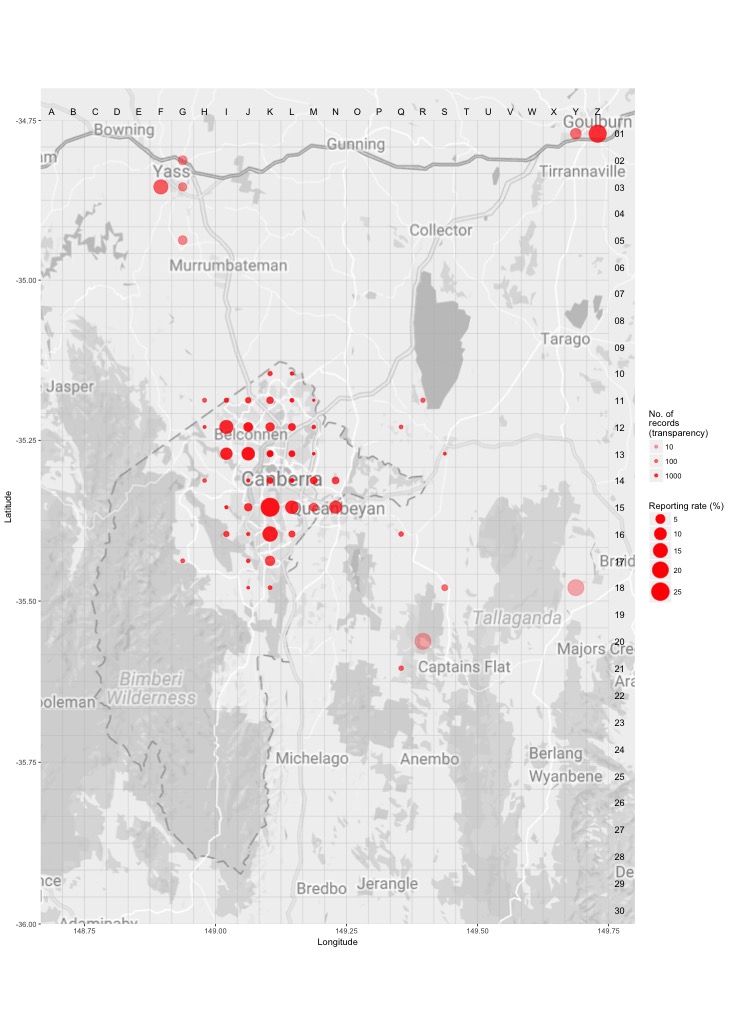
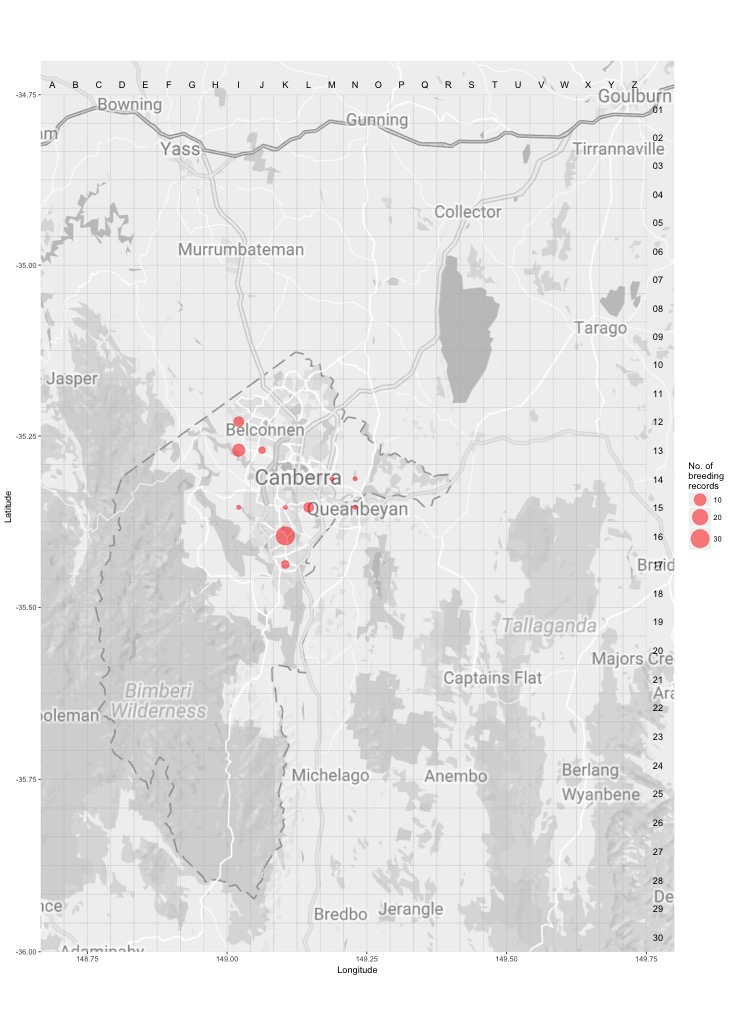
Breeding map
Breeding - 2017
This map shows the breeding distribution of the Rainbow Lorikeet for 2017.
The red circles are the grid cells where breeding activity for Rainbow Lorikeet have been reported.
The size of the circle represents the number of reports. 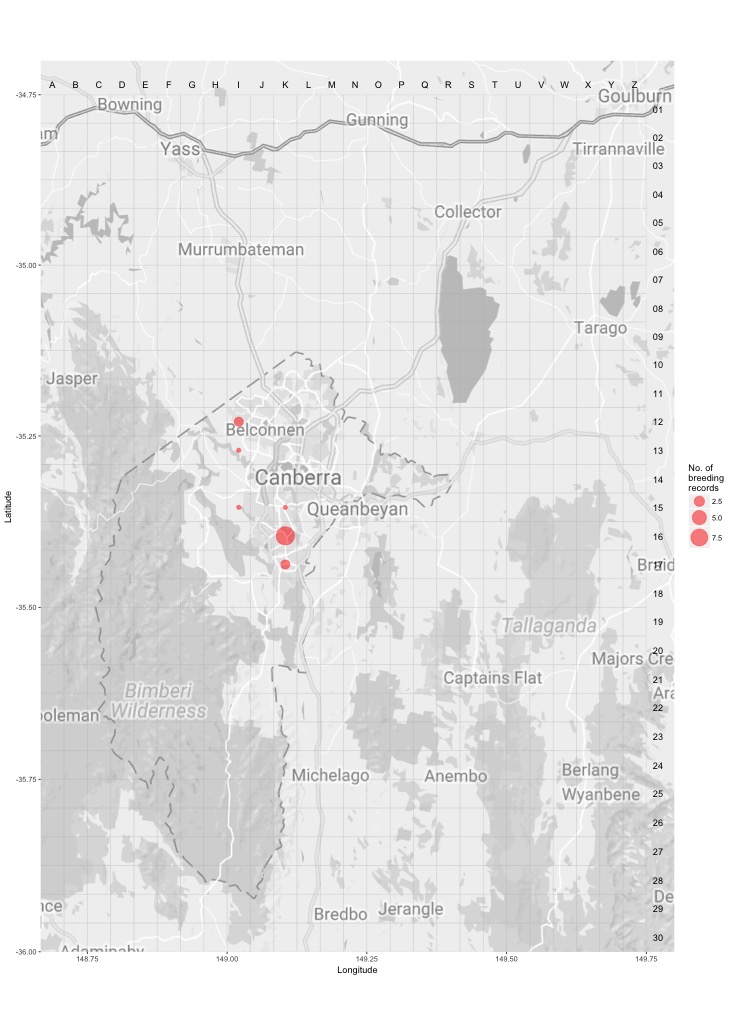
Breeding - all years
This map shows the breeding distribution of the Rainbow Lorikeet for all years.
The red circles are the grid cells where breeding activity for Rainbow Lorikeet have been reported.
The size of the circle represents the number of reports.